The area under the concentration vs. time curve is a useful description of exposure of drug following administration. There are different ways in which AUC may be calculated, and terminology may vary from one source or text to another. This page summarizes the calculations and terminology that may be encountered.
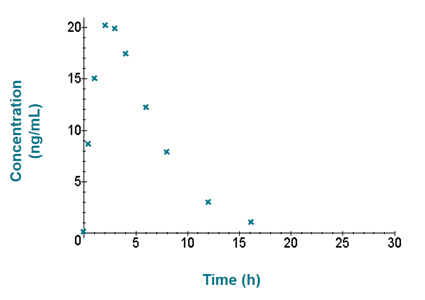
Bioanalytical data consists of a series of concentrations at various time points following dose administration.
There are additional rules, and these are specified in our study plans.
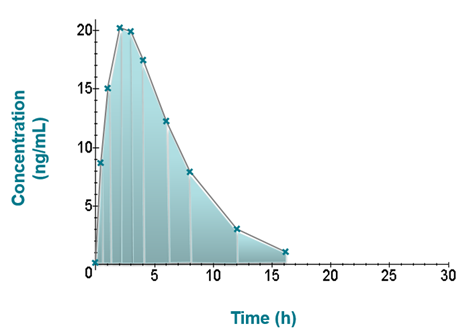
The area under each of the trapezoids are summed (shaded area above) to give an AUC:
AUC0-n = Ʃ[0.5*(t2-t1)* (Cp1+Cp2)]
Where a logarithmic trapezoidal rule is employed for a trapezoid, the formula is:
AUCt1-t2 = (t2-t1)*((Cp1-Cp2)/ln(Cp1/Cp2 ))
- AUC0-last describes the area under the curve up to the last quantifiable time-point (sometimes referred to as AUC0-t)
- AUC0-x describes the area under the curve limited to a specific time (e.g. AUC0-12h). This time may fall between available data points, in which case interpolation is used to make the calculation
- AUC0-inf extrapolates the area to infinite time. This requires a terminal elimination phase to be characterized. AUC0-inf comprises AUC0-last plus the extrapolated area AUCt-inf which is calculated by
AUCt-inf = Cpt / Kel
where Cpt is the plasma concentration at the last quantifiable time point and Kel is the terminal elimination rate constant
- AUC0-tau describes the area under the curve limited to the end of a dosing interval. The end of the dosing interval may fall between available data points, in which case interpolation is used to make the calculation
- AUCall describes the area under the curve inclusive of any final time-point that is below the limit of quantitation
Can we help you?
Resolian’s team of pharmacokineticists has many years of experience carrying out pharmacokinetic (PK) and toxicokinetic (TK) analysis for all stages of drug development, providing you with expertise, flexibility and quality.
Reach out to us directly to learn more about Resolian’s Statistical PK Analysis services.